This function use the input trajectory object or TIDES AVL data to draw a
trajectory plot (i.e., linear distance versus time) for each trip. This
function allows for the plotting of spatial features and labels for these
features. A ggplot2 object is returned, which can be further modified
and customized as desired.
Usage
plot_trajectory(
  trajectory = NULL,
  distance_df = NULL,
  plot_trips = NULL,
  timestep = 5,
  distance_lims = NULL,
  center_trajectories = FALSE,
  feature_distances = NULL,
  convert_to_timezone = TRUE,
  traj_color = "coral",
  traj_type = "solid",
  traj_width = 1,
  traj_alpha = 1,
  traj_legend = NULL,
  feature_color = "grey30",
  feature_type = "dashed",
  feature_width = 0.8,
  feature_alpha = 0.8,
  feature_legend = NULL,
  label_field = NULL,
  label_size = 3,
  label_alpha = 0.6,
  label_pos = "left"
)
Arguments
- trajectory
Optional. A trajectory object, either a single trajectory or grouped trajectory. If provided,
distance_dfmust not be provided. Default isNULL.- distance_df
Optional. A dataframe of time and distance points. Must include at least
event_timestamp,distance, andtrip_id_performed. If provided,trajectorymust not be provided. Default isNULL.- plot_trips
Optional. A vector of
trip_id_performeds to plot. Default isNULL, which will plot all trips provided in thetrajectoryordistance_df.- timestep
Optional. If
trajectoryis provided, the time interval, in seconds, between interpolated observations to plot. Default is 5.- distance_lims
Optional. A vector with
(minimum, maximum)distance values to plot.- center_trajectories
Optional. A boolean, should all trajectories be centered to start at the same time (0 seconds)? Default is
FALSE.- feature_distances
Optional. A dataframe with at least numeric
distancefor features. Default isNULL.- convert_to_timezone
Optional. Should numeric epoch times be converted back to readable hour-minute-second time values, using the agency timezone? Default is
TRUE.- traj_color
Optional. A color string, or a dataframe mapping an attribute in
distance_dfortrip_id_performedintrajectoryto a color. Must contain columncolor. Default is"coral".- traj_type
Optional. A string specifying the
ggplot2linetype, or a dataframe mapping an attribute indistance_dfortrip_id_performedintrajectoryto a linetype. Must contain columnlinetype. Default is"solid".- traj_width
Optional. A numeric, the width of the trajectory line. Default is 1.
- traj_alpha
Optional. A numeric, the opacity of the trajectory line. Default is 1.
- traj_legend
Optional. A boolean, should a legend be shown for trajectory formatting? Default is
NULL, where a legend will only appear if the linetype or color format is mapped to.- feature_color
Optional. A color string, or a dataframe mapping an attribute in
feature_distancesto a color. Must contain columncolor. Default isgrey30.- feature_type
Optional. A string specifying the
ggplot2linetype, or a dataframe mapping an attribute infeature_distancesto a linetype. Must contain columnlinetype. Default is"dashed".- feature_width
Optional. A numeric, the width of the feature line. Default is 0.8.
- feature_alpha
Optional. A numeric, the opacity of the feature point. Default is 1.
- feature_legend
Optional. A boolean, should a legend be shown for feature formatting? Default is
NULL, where a legend will only appear if the linetype or color format is mapped to.- label_field
Optional. A string specifying the column in
feature_distanceswith which to label the feature lines. Default isNULL, where no labels will be plotted.- label_size
Optional. The font size of the feature labels. Default is 3.
- label_alpha
Optional. The opacity of the feature labels. Default is 0.6.
- label_pos
Optional. A string specifying the label position on the graph. Must be either
"left"or"right". Default is"left".
Details
Input Trajectory Data
There are two ways to provide data to these plotting functions:
A single or grouped trajectory object. This will use the direct trajectory function at a resolution controlled by
timestep. This is simplest, and looks best when zooming in usingdistance_lims. The only attribute that can be mapped to if using a trajectory istrip_id_performed.A
distance_dfof TIDES AVL data. This will use the distance and time point pairs for plotting, and draw linearly between them. This will look similar to a plot usingtrajectorywhen zoomed out. It is most useful if you want to map formatting to attributes other thantrip_id_performed, such as a vehicle or operator ID. If starting with atrajectory, but the additional control over formatting is desired, consider usingpredict()to generate distance and time points to plot, then joining the desired attributes to thetrip_id_performedcolumn.
Note that only one of trajectory and distance_df can be used. If both
(or neither) are provided, an error will be thrown.
Features and Labels
Often it is useful to plot the features of a route, such as its
stops/stations or the traffic signals it passes through. Use
feature_distances to provide information about spatial features to plot.
Each row in feature_distances should include at least a distance column.
Each of these rows will be plotted as a horizontal line across the graph.
These features can also be labeled. Set label_name to a character string
corresponding to a field in feature_distances to generate labels with
this field as their text. The color of the label will automatically match
that of the feature they describe. The label placement is controlled by
label_pos, which can be set to "left" or "right".
Formatting Options
Once a layer is created on a ggplot2 object, it is difficult to change its
formatting. As such, this function attempts to provide as much flexibility
in formatting its layers as possible. The resulting plot includes three
layers:
Vehicle trajectories, controlled by
traj_color,traj_type, andtraj_width, andtraj_alpha.Features, controlled by
feature_color,feature_type,feature_width, andfeature_alpha.Labels, controlled by
label_size,label_alpha, andlabel_pos.
All of these formats can be controlled by inputting a single string or numeric. The following attributes can also be modified using a dataframe, mapping them to attributes of the layer:
traj_typeandfeature_type: A dataframe with one column namedlinetype, and another column sharing a name with a column indistance_dforfeature_distances(or, if usingtrajectory, a column namedtrip_id_performed). The values inlinetypeshould be validggplot2linetypes, and the values in the mapping column should match the values in feature or trip column.traj_colorandfeature_color: A dataframe with one column namedcolor, and another column sharing a name with a column indistance_dforfeature_distances(or, if usingtrajectory, a column namedtrip_id_performed). The values incolorshould be valid color strings, and the values in the mapping column should match the values in feature or trip column.
Note that if inputting trajectory, instead of distance_df, veh_shape
and traj_color and traj_type can only be mapped to trip_id_performed.
If using distance_df, they may be mapped to any column in distance_df
(e.g., vehicle or operator IDs).
Examples
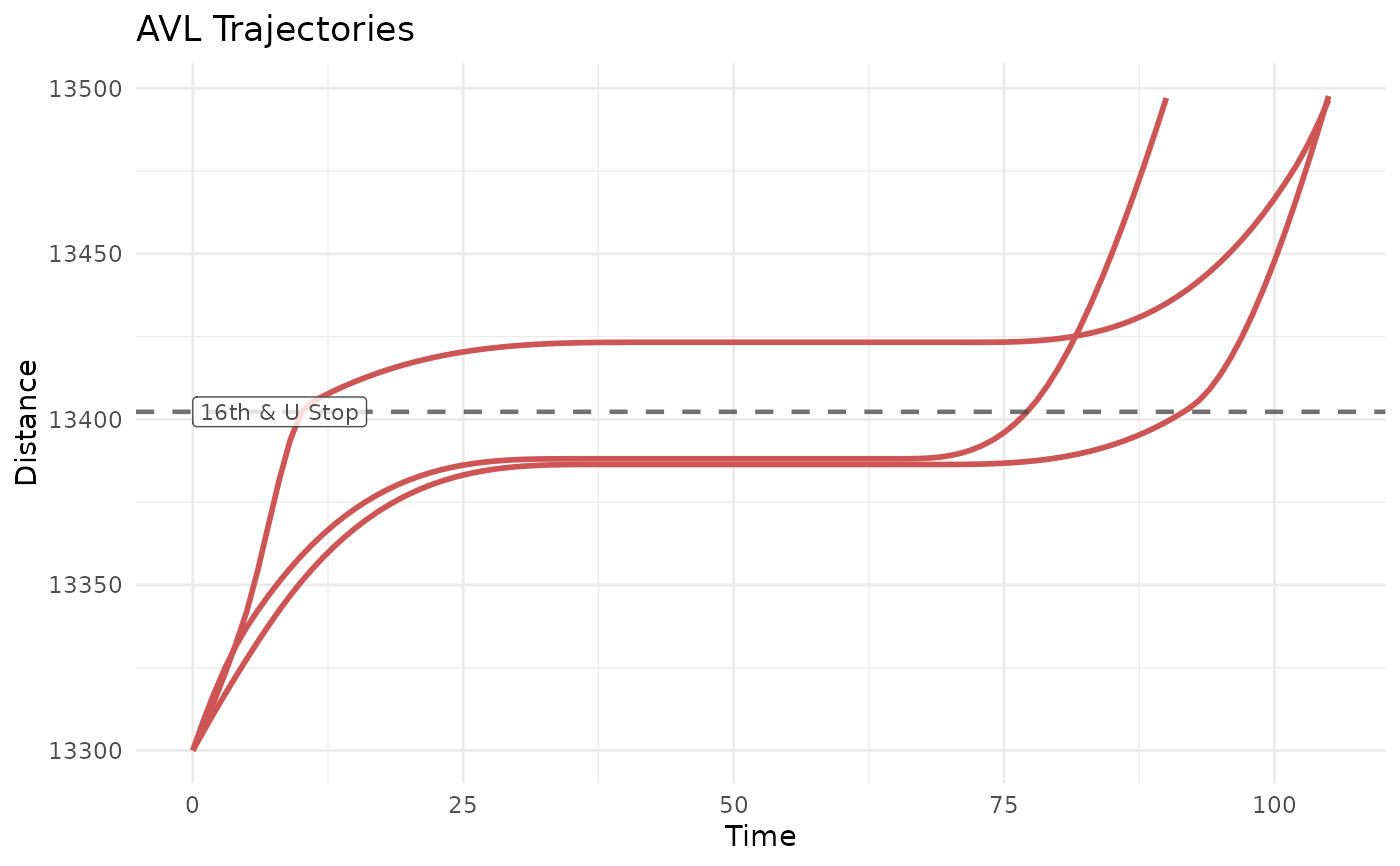
# Get input data
c53_traj <- new_transittraj_data("get_trajectory_fun")

# Set my parameters
my_features <- data.frame(name = c("16th & U Stop"),
                          distance = c(13402.281))
my_dist_range <- c(13300, 13500)

# Run function
plot_trajectory(trajectory = c53_traj,
                feature_distances = my_features,
                label_field = "name",
                label_alpha = 0.8,
                distance_lims = my_dist_range,
                traj_color = "indianred3",
                center_trajectories = TRUE,
                timestep = 1)