This function generates a quick plot of a single or grouped trajectory
object. Using the trajectory function, the entire trajectory will be plotted
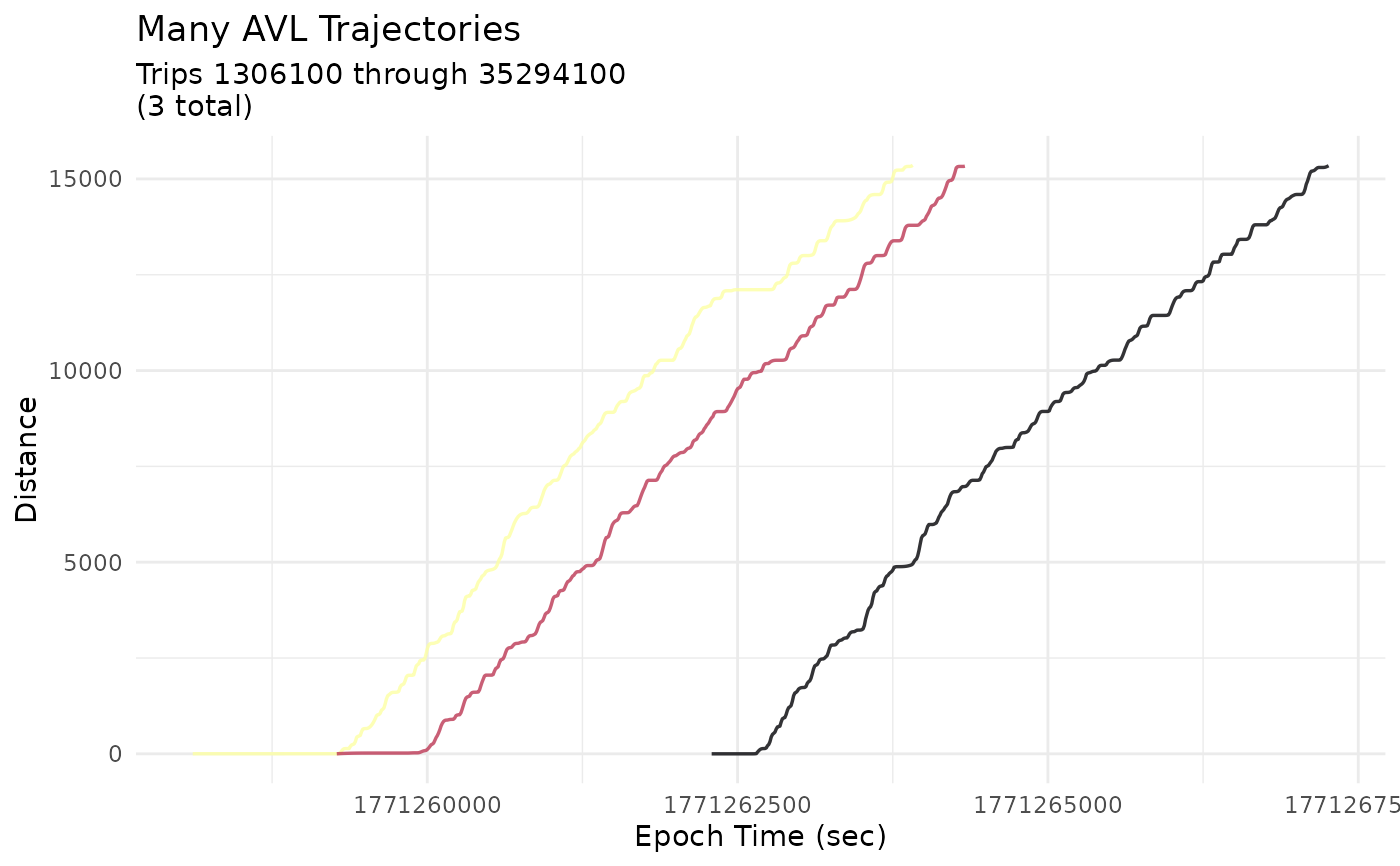
at a temporal resolution of 10 seconds. For grouped trajectories, a maximum
of 50 trips will be plotted. For more control over plotting and
formatting, see plot_trajectory().
Examples
# Get input data
c53_traj_grouped <- new_transittraj_data("get_trajectory_fun")
c53_traj_singles <- new_transittraj_data("get_trajectory_fun_single")
# Plot: Grouped trajectory object
plot(c53_traj_grouped)
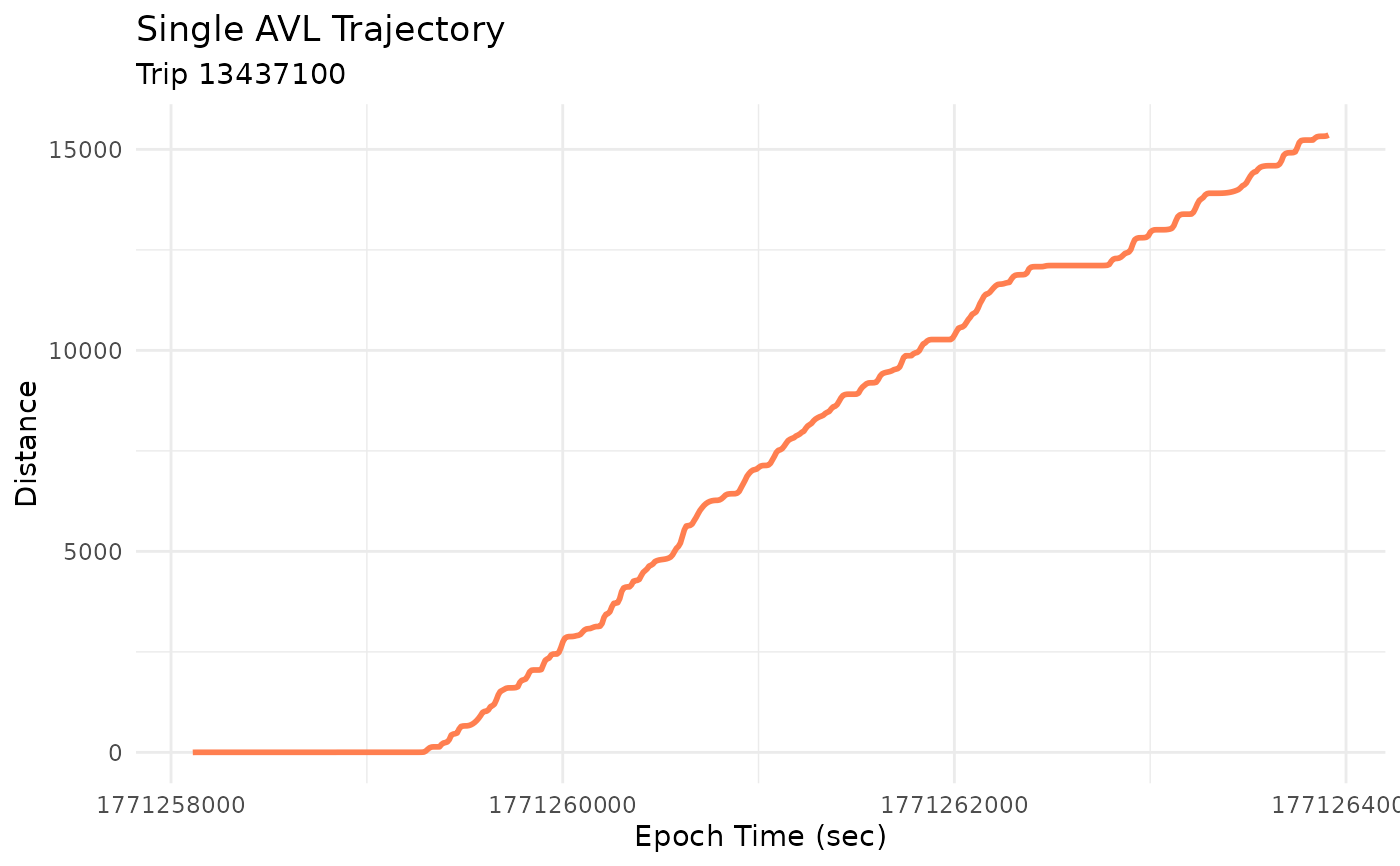
 # Plot: Single trajectory object
plot(c53_traj_singles[[2]])
# Plot: Single trajectory object
plot(c53_traj_singles[[2]])